Jump start your digital creativity with these 10 graphic design infographics
The beginning is always the hardest. The only thing thing harder than starting something is staying on track and being consistent. So to begin on the road of graphic design, you should be aware of what is waiting for you along the way. And even with all the resources available through your internet connection, you should keep in mind that, as with every profession, things will get rough. The competition is pretty high and getting even tighter as more and more people are self-thought and the industry is getting more and more specialized.
If the last phrase didn’t already scare you off, lets break it down. The post will focus on outlining the most important aspects in the life of a graphic designer, at the beginning of the road. We chose to talk about it in the friendliest of ways graphic design (you guessed it!) has developed in recent years – through infographics. There’s a mad science behind them as well, but that’s a post for another day.
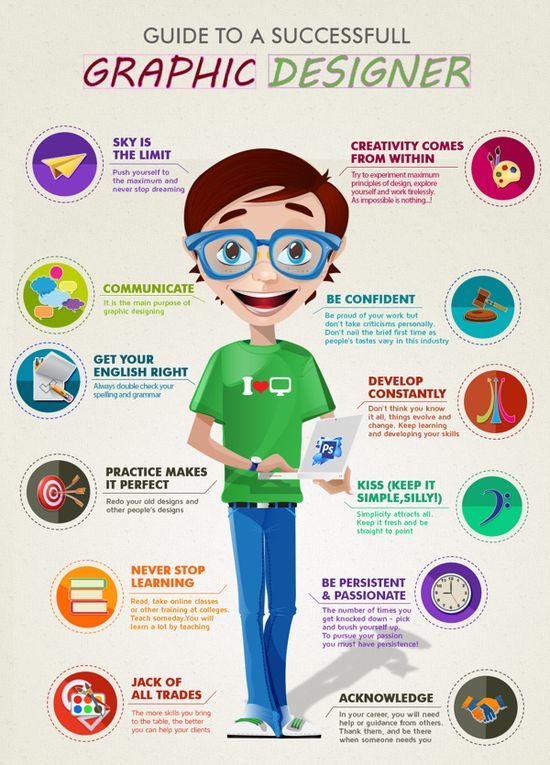
The industry is built around one’s ability to visualize what other people can’t, the skills to bring vague ideas to life or condense a number of concept into one image. The infographic below will highlight the approach you need in order to accomplish that:
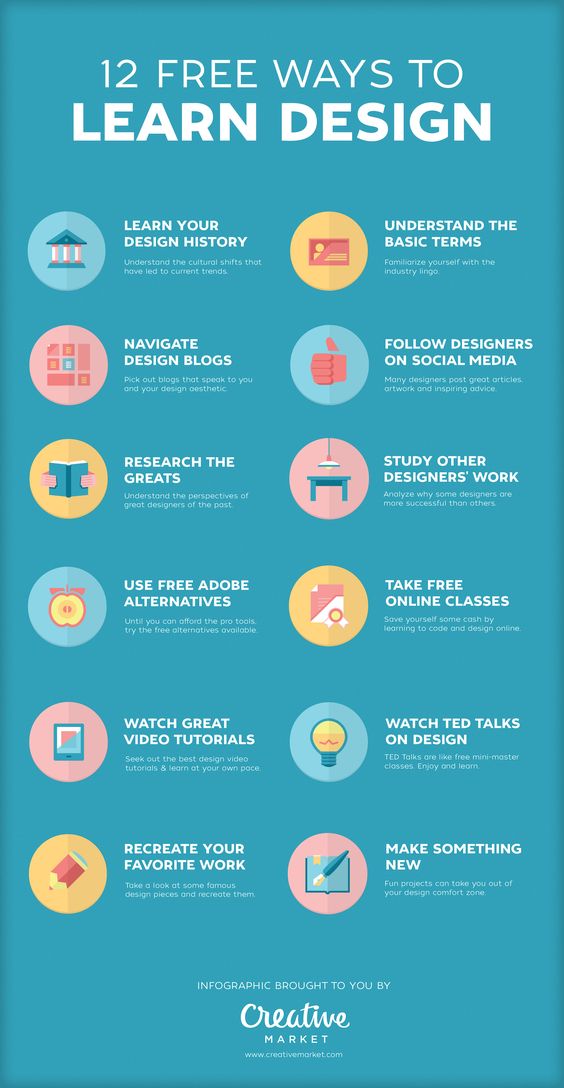
The first self-teaching lesson to master is: exploring all free resources, free ways, free methods before you throw money at all kinds of courses, materials, tutorials etc. So, this infographic will guide you through 12 free ways to learn design, courtesy of Creative Market.
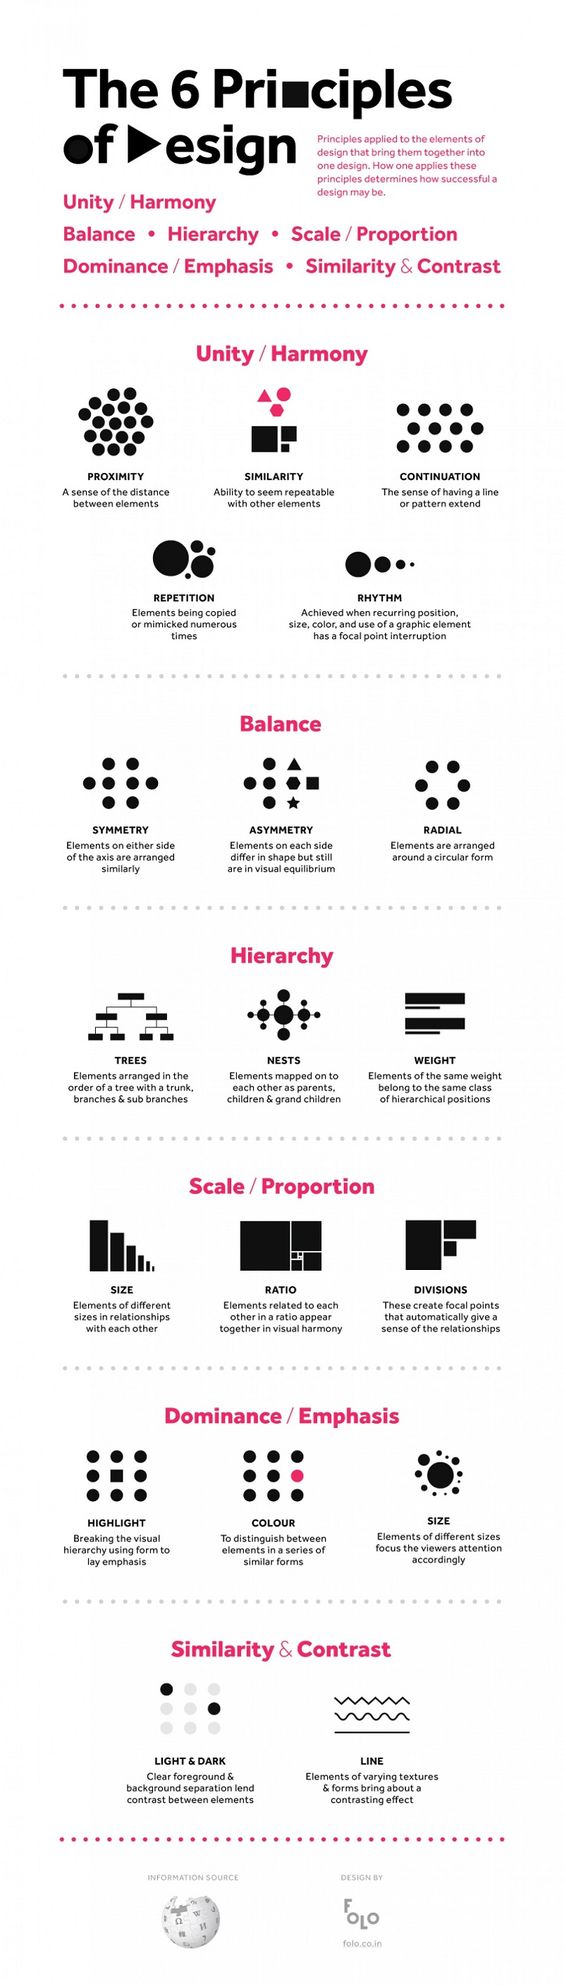
The next infographic explores the objective principles that you need to be acquainted with, before a design is passed through any subjective filters of aesthetic. Master these 6 and you can then focus on revolutionizing, breaking rules or innovating.
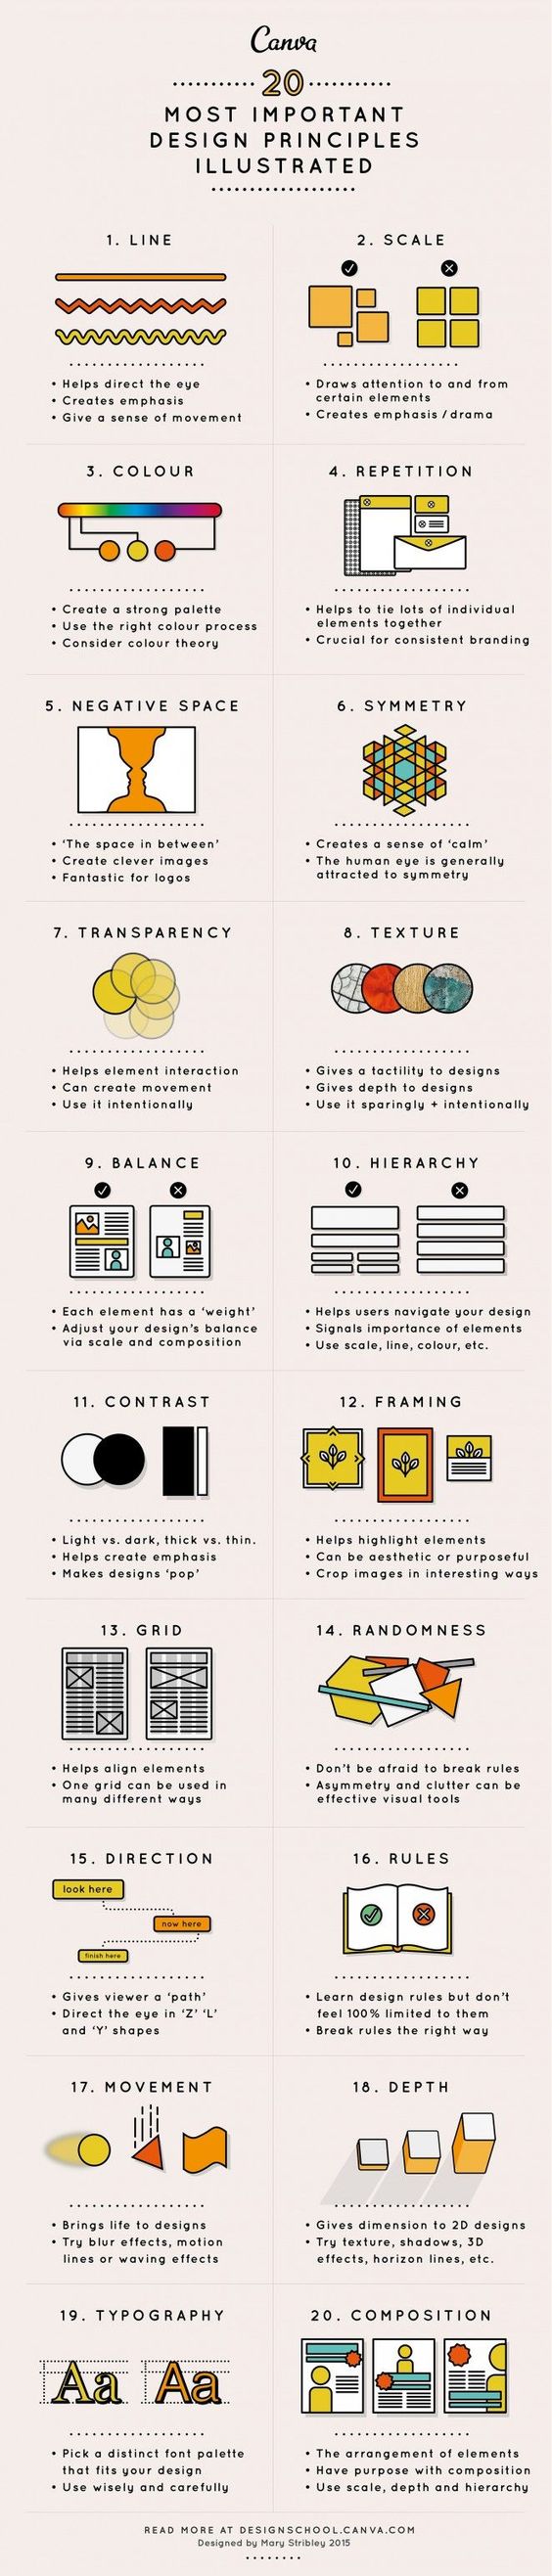
Another fun infographic that presents 20 principles in a fun way is the one from Canva:
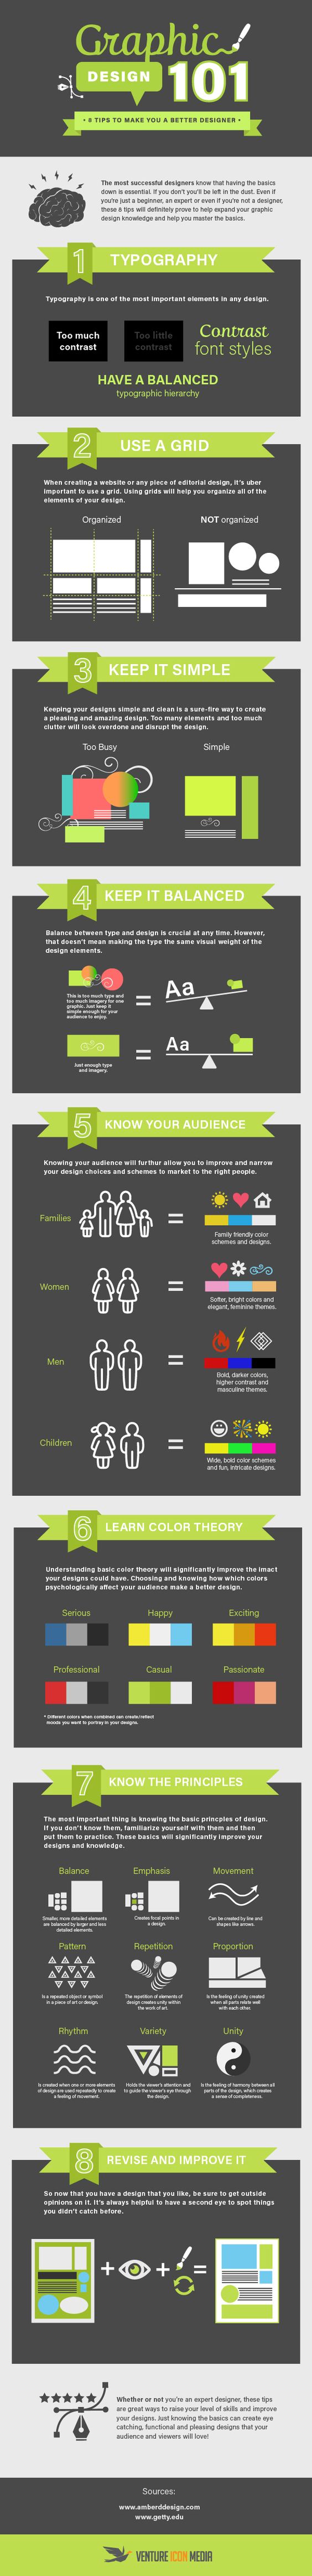
The following is more specific, more technical. Try to follow these tips to become better and set yourself on the road of becoming an expert in the field. All of them would be useless honestly, if you do not practice the very last tip: revise and improve it. Which means it will improve by trial and error, by going back and forth, by experimenting.
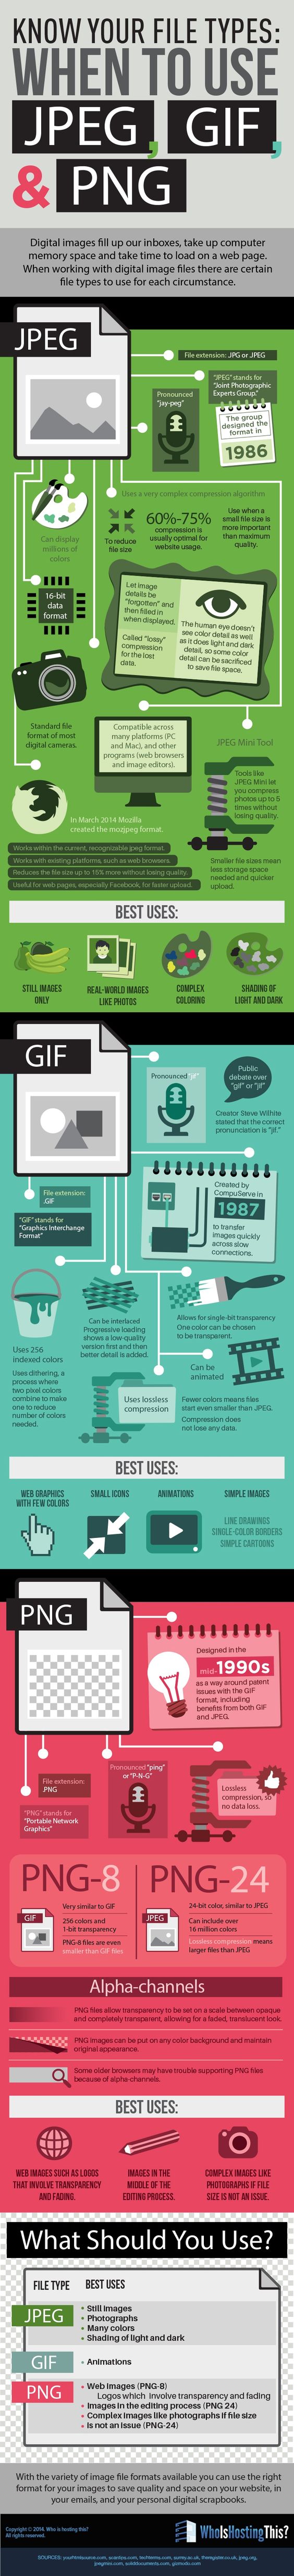
The next one will get deeper into technicalities that you must have a very excellent command of. It’s a comprehensive breakdown of the most used and sometimes abused file types in graphic design: jpg, png and gifs. For a more detailed explanation of more file types, click here.
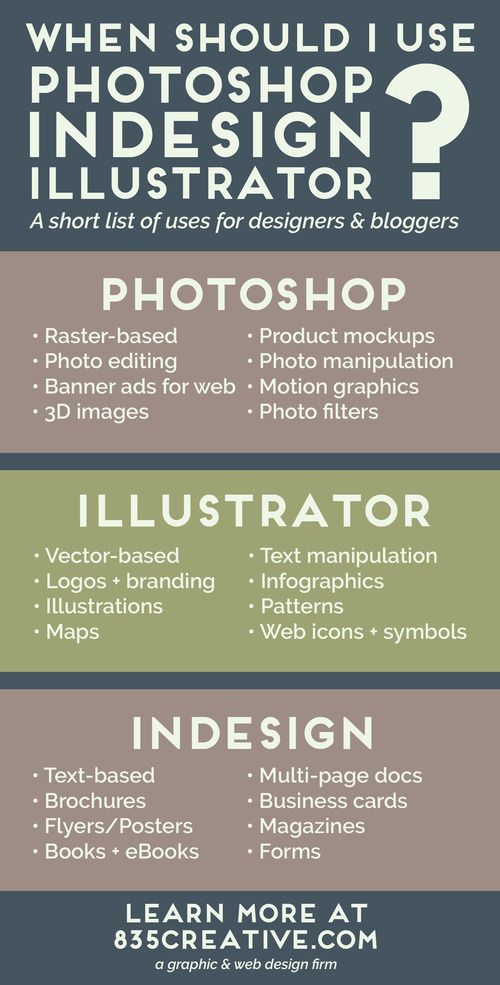
The next simple infographic is actually a very short presentation of the three most used softwares in the graphic design industry and their main characteristics:
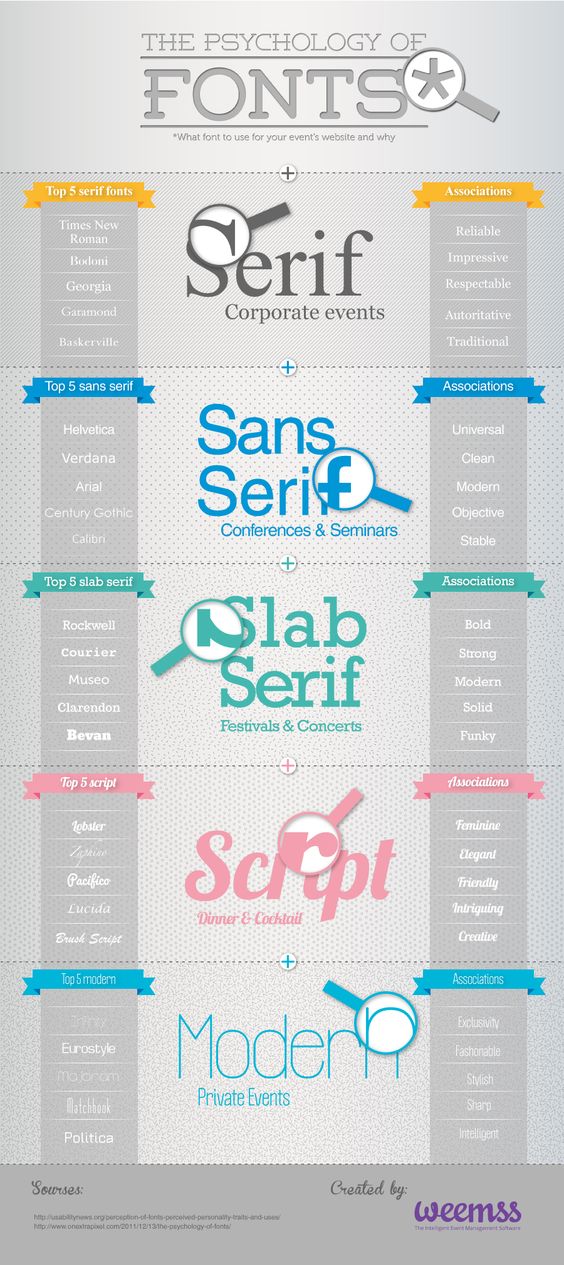
The infographic below will turn out very helpful, touching upon a delicate, highly discussed subject in graphic design: fonts and when to use them. Never has the phrase “God is in the details” been so true!
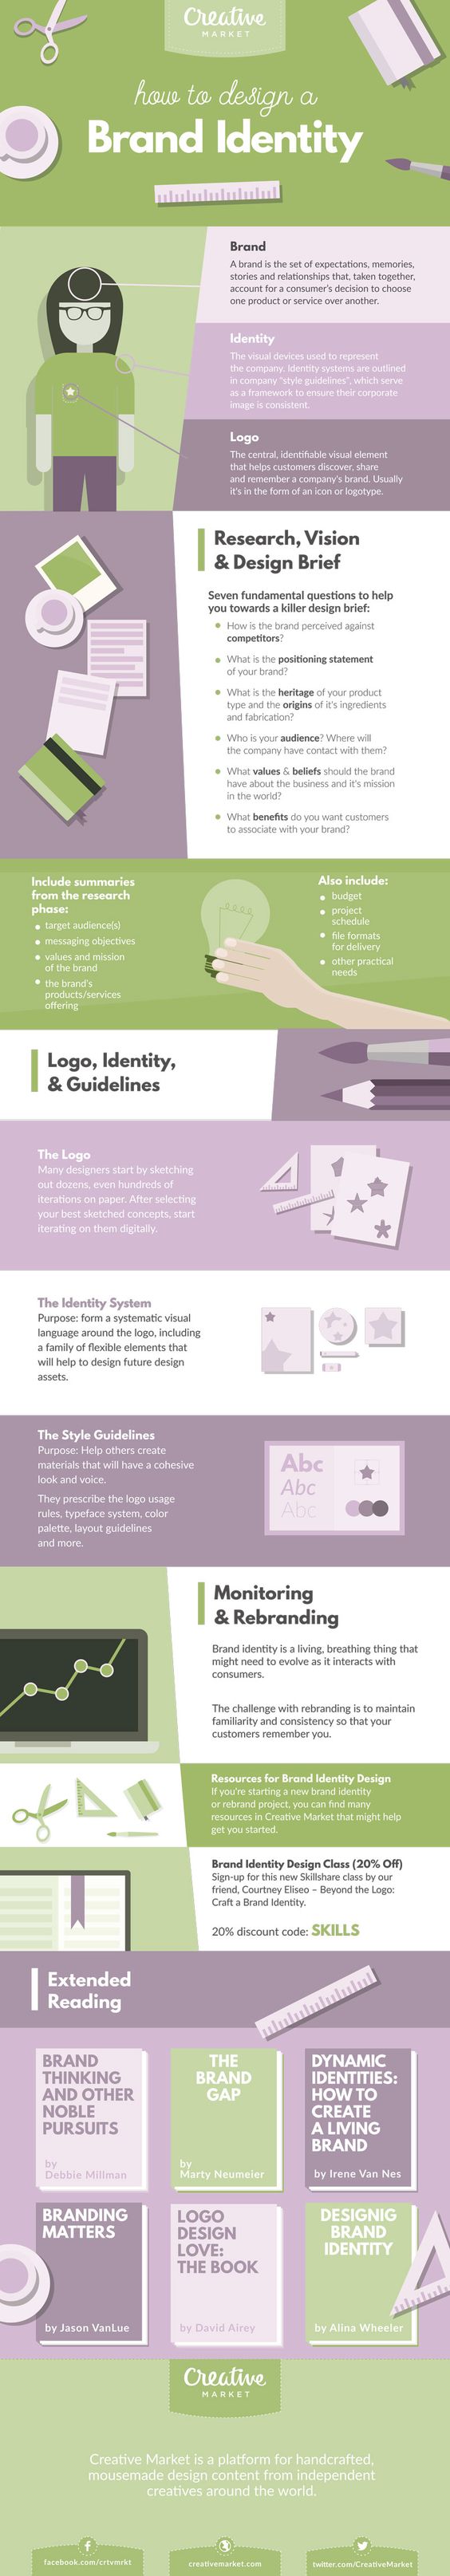
Next on the list is dealing with a complicated branch of graphic design, that will also test your marketing and consumer perception skills and knowledge: brand identity and the many faces of logo design.
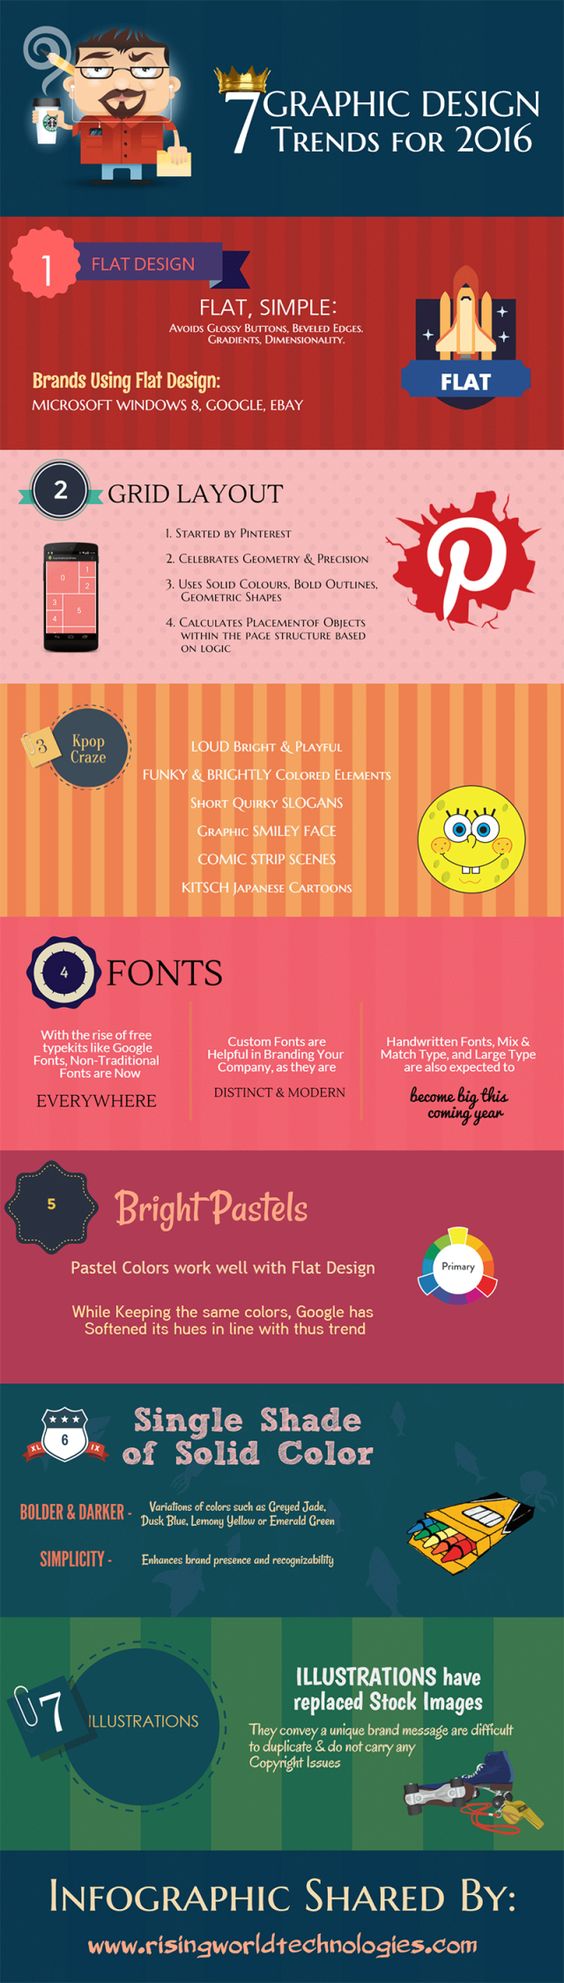
And last but not least, is a brief presentation of major trends that have and are still going strong for the year of 2016. Staying in touch with the popular choices of the public is very important to be able to incorporate or avoid certain elements. Some are classics others just become cliché, and no client will pay or appreciate forgettable or overused imagery. We’re heading towards the end of the year but these trends are sure to hang around at least another good 6 months.